Safari/WebKit has a new Web Inspector
One of the new things in the Safari 3 beta is that Safari now has a very useful developer tool called the Web Inspector.
The Web Inspector is opened by right-clicking and selecting “Inspect Element” from the contextual menu, and provides some of the features that the Firebug extension does for Firefox, but not nearly as advanced (yet). The Web Inspector is currently Mac-only as it is not available in the Safari 3 beta for Windows. But big changes are coming.
In recent WebKit nightly builds, both Mac and Windows versions have a brand new Web Inspector, which is very different from the old one. The new Web Inspector, as mentioned in Yet another one more thing… a new Web Inspector! at Surfin’ Safari:
- Has a completely redesigned interface
- Works inside third-party applications, not just Safari
- Is dockable to the inspected page
- Shows all resources included by the page, sorted into categories (documents, stylesheets, images, scripts, and other)
- Can search all text-based resources
- Has a console that show errors and warnings with live JavaScript evaluation
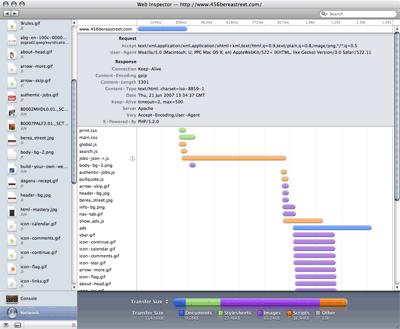
- Features a Network panel that shows loading time for each resource, and optionally HTTP request and response headers
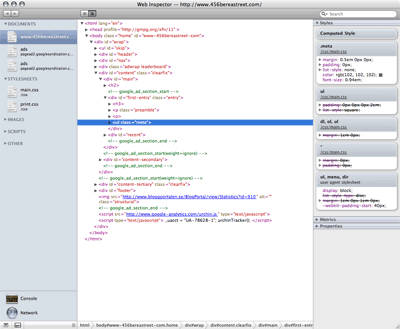
- Displays syntax highlighted HTML
- Has inline JavaScript and HTML error reporting
Here’s what the Web Inspector looks like when viewing the DOM:

The Web Inspector’s network panel looks like this:

After playing around with it for a while, my impression is that though the Web Inspector still is not as feature rich as Firebug, the new version is a great improvement. If it had live editing of HTML and CSS and a few more of Firebug’s features, the Web Inspector would make Safari a great tool for Web developers.
- Previous post: Keep HTML and CSS out of my inbox. Please.
- Next post: London 2012 Olympics branding film causes epileptic seizures